Official digital twins
The two posts before this one argued about city twins from the outside. Part 1 wrote down the mental model and recorded the corrections; Part 2 checked that argument against a decade of programs. This post is a side quest: I went and stood inside one.
I'd been working my way through the digital-city-twin space: reading up on the stacks people build them on, and happily running my own simulations. Road traffic in SUMO (Simulation of Urban MObility), agent-based travel demand in MATSim (Multi-Agent Transport Simulation), that kind of thing. Sooner or later that curiosity turns to the question: what do the real twins look like, the official ones governments actually run?
In New South Wales (NSW) the answer is the NSW Spatial Digital Twin, a government-run 2D/3D/4D model of the state built by the Department of Customer Service (DCS) Spatial Services with Data61, the digital research arm of the Commonwealth Scientific and Industrial Research Organisation (CSIRO). Its public front door is the Spatial Digital Twin Explorer (SDT Explorer), the viewer that in May 2025 replaced the long-serving Spatial Information eXchange (SIX) Maps, laying authoritative spatial data over a precise basemap of every street, parcel and building. Esri, the company whose mapping platform runs it, calls it "one of the largest spatial digital twins in the world," now spanning more than nineteen council areas.
It isn't the only one. Most Australian states have stood up a twin, and they interlink into a loose national ecosystem.
| Twin | Where | What it is | Stack |
|---|---|---|---|
| NSW SDT Explorer | New South Wales | Successor to SIX Maps. Foundation spatial data in 2D/3D/4D, federated across government portals. The twin we're standing in. | Esri · ArcGIS Enterprise |
| Digital Twin Victoria | Victoria | Launched Aug 2022 on a $37.4M program; 4,000+ datasets with 3D buildings, overshadowing and underground utilities. | TerriaJS · CesiumJS |
| Queensland Digital Twin | Queensland | Part of the same national family: land use, 3D photogrammetry and live feeds streamed as 3D Tiles in the browser. | TerriaJS · CesiumJS |
Victoria and Queensland, and NSW's own earlier digitaltwin.terria.io viewer, run on CSIRO Data61's TerriaJS with Cesium. The SDT Explorer used here is the Esri-based successor.
The stack
My own experiments had been on the simulation side of the twin world: engines that move agents and vehicles around a network. The official twin is the other half, the authoritative, continuously updated model of the physical city those simulations want to run against.
- SUMO · traffic microsimulation
- MATSim · agent-based transport
- TerriaJS + Cesium · open-source twin viewers
- Esri ArcGIS · the NSW twin's platform
SDT Explorer is a browser app over an ArcGIS Enterprise back end. Every dataset is a Representational State Transfer (REST) service you can query directly, and that was the moment the side quest suggested itself: if the layers are open services and there's an "Add your own data" button, then anything I could shape into a spatial file could sit on the same map.
| Layer | What it is |
|---|---|
| Viewer SDT Explorer | Web client for 2D/3D/4D, with identify, measure, swipe and line-of-sight tools. |
| Platform ArcGIS Enterprise | The Spatial Collaboration Portal: hosting, sharing and federating foundation data. |
| Services REST FeatureServers | Each theme is an open, queryable endpoint returning JavaScript Object Notation (JSON) geometry and attributes. |
| Upload Add your own data | Bring a file up to 150 megabytes and it becomes a client-side overlay layer instantly. |
Layers, formats, and the fabric of the cadastre
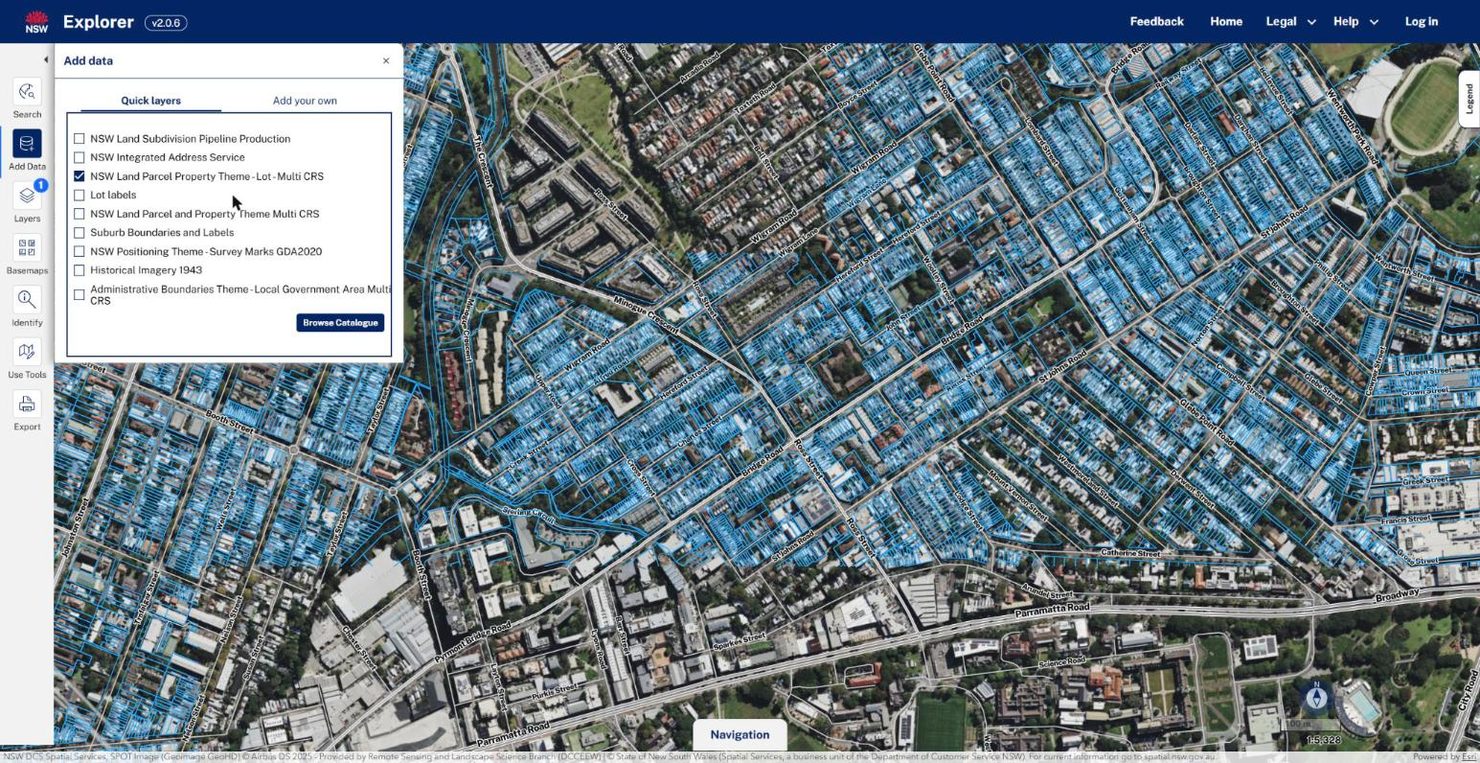
The base data is organised into a handful of authoritative themes, each a live service: Land Parcel & Property (lots), Geocoded Addressing (points), Administrative Boundaries, Imagery, Elevation & Depth, Transport and Water.
To add your own, the uploader accepts a short menu of formats: zipped shapefile, CSV, KMZ, geotagged JPEG, GPX, and a web service URL. The zipped shapefile is the one that carries polygons and a full attribute table, so it's what a lot-level census layer has to be.
A census-night coincidence
The timing was pure accident. The evening I was poking around the official twins happened to be census night, 11 August 2026. I'd filled in the form for my current location a few hours earlier. So when it clicked that the twin would take my own layers, the obvious playful question was: could I put the census itself on this map? It seemed like a fun thing to try on the one night of the year everybody is being counted.
Fresh census data takes many months to publish, and NSW won't see 2026 figures until well into 2027, so I reached back to the 2021 census night instead, the last time everyone was counted (10 August 2021). And there was a real puzzle to make it interesting. The Australian Bureau of Statistics (ABS) never publishes "where people actually were" below the Statistical Area Level 1 (SA1), a statistical area of a few hundred people. Nothing exists at the parcel level. Getting to a per-lot layer meant borrowing detail from the cadastre itself, in three moves.
A. Get the census-night data
From the ABS 2021 Place of Enumeration Profile (PEP) DataPack (table P01, Tot_P_P) for every NSW SA1, plus the Mesh Block counts spreadsheet for residents and dwellings. Both pulled straight from abs.gov.au.
B. Scope it to Forest Lodge
Query the ABS boundary service for the Forest Lodge suburb polygon, take the Mesh Blocks whose centre falls inside it, and keep only their 12 SA1s, clipping a state-wide file down to one square-kilometre neighbourhood.
C. Transform and disaggregate to lots
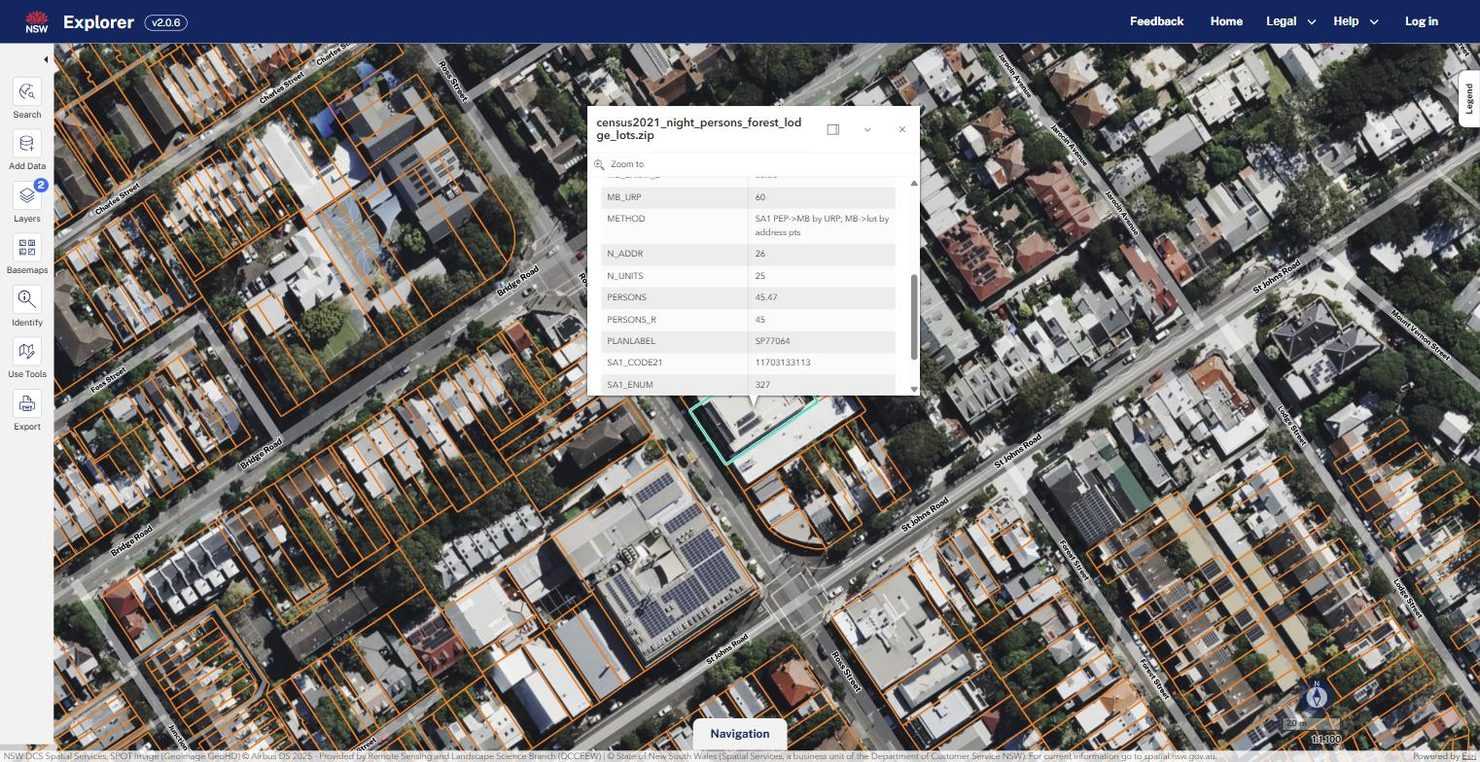
Split each SA1's count across its Mesh Blocks (by usual residents), then across the lots inside each Mesh Block, weighted by the number of geocoded address points on the lot, so a 25-unit apartment block draws 25× a single house. Write the result as a zipped shapefile.
| Forest Lodge, 2021 census night | Count |
|---|---|
| SA1 areas | 12 |
| Mesh Blocks | 56 |
| Lots mapped | 775 |
| Persons placed | 4,913 |
Twenty-one attribute fields ride along on every lot: cadastre IDs, the Mesh Block and SA1 it sits in, the published counts it was derived from, the address-point weight, and the estimate itself (PERSONS / PERSONS_R). The file is 378 kilobytes and uploads to SDT Explorer in seconds, and the orange colour coding on the map is applied by the same build script.
The whole pipeline ran in two browser consoles: step A on abs.gov.au, because its DataPack downloads are only fetchable from that origin, and steps B and C on the SDT Explorer tab. No desktop mapping software, no build step, no libraries. The shapefile and ZIP writers are hand-rolled, so the whole thing fits in a console paste.
How many people were there in my building
Here is my census data overlaid on the NSW digital portal. Nice to know that there were 45 people in this building on the last census night from 2021. I'll create a dataset to overlay on the digital twin portal once 2026 census data is available.
10757722000, itself a slice of SA1 …3113's published 327 residents.Sources & data
- SDT Explorer, the NSW Spatial Collaboration Portal - portal.spatial.nsw.gov.au · NSW Spatial Digital Twin, Spatial Services - spatial.nsw.gov.au
- NSW Spatial Digital Twin, Esri Australia - esriaustralia.com.au · SDT Explorer to replace SIX Maps, Spatial Source - spatialsource.com.au
- Digital Twin Victoria platform now live - land.vic.gov.au · Cesium on state-sized digital twins - cesium.com
- ABS 2021 Census DataPacks, Place of Enumeration Profile - abs.gov.au · ABS 2021 Census Mesh Block counts - abs.gov.au
- NSW Land Parcel & Property Theme (FeatureServer) - portal.spatial.nsw.gov.au · NSW Geocoded Addressing Theme (FeatureServer) - portal.spatial.nsw.gov.au