The request
A state government wants to build a new city on the edge of the Mumbai region, around the belt of warehouses that already takes the port's containers inland and sends them across the country. The city exists to serve that logistics hub. Could we propose software to plan it, visualise it, estimate it and simulate it - and what, exactly, could we offer?
The brief pointed at this series as evidence of what we had tried, and at the Newcastle and Mumbai twin as the most ambitious thing we had built. It asked for plain English, every abbreviation spelled out, a hover definition for every specialist term, references and links, and a strong visual voice. It said there were no other details yet, that this was a starting pitch, and that animations of what we could build towards over time were welcome. The proposal would be written, like the twin, with an AI agent doing the research and the building.
Draft one: the careful proposal
The first draft was titled "Build Bhiwandi Twice": once in software, where a wrong road or a forecast three times too high costs nothing to fix, then once on the ground. It laid out how cargo moves through the region today, what was being planned, and where the belt is already under strain - choke points on the roads, a river crossing its danger mark, warehouse fires. It surveyed fourteen ports, logistics hubs and new cities, and found that what arrived was often a third to a half of what the plan had promised. It offered a twin that would estimate everything "as a range, never one number", and it set a rule before any prediction: the model must first reproduce a change that has already happened.
That is the corrections I made to my first model of a city, written as a proposal. For a first pitch it asked too much reading of a department that had not yet seen what a twin could show it.
Draft two: show, do not argue
The second brief turned the draft around. It was not about solving one hard problem; it was about showing what we can do, for any city, not just this one. In paraphrase, it asked for:
- Less text, better pictures. Short headlines and bullets, no footers or numbering, and visuals realistic enough to feel like the city - OpenStreetMap, 3D buildings, photogrammetry where it helps.
- The best twins on Earth, studied and borrowed from. What Shanghai, Singapore, Hangzhou and the rest do best, and what we would take from each.
- Prediction beyond traffic. Floods, heat, water, power, air, disease: the models a city actually needs.
- A link to the control room. Live feeds from the city's SCADA systems into the twin.
- The big day. Religious processions, finals and marathons, planned in the twin before they happen.
- Time as a slider. Roads, pipes and buildings with their ages, scrolled through past, present and future, with a list of what needs attention next.
- City-builder views. The way a game like Cities: Skylines lets you flip between traffic, zoning, sewage and power.
- Ambition. Promise less in writing and show more in pictures: what is possible given the compute, and that we have the know-how to build it.
Then came twenty rounds of refinement, almost all of them about how the city looks and moves. The 3D buildings first rendered in a fixed square, then in a circle, then wherever the camera pointed. They were made to load nearest-first instead of in random blocks. The district-drawing slide was rebuilt so that the real buildings already standing there grow out of the ground, networks first. The arrow keys stopped moving the camera and started changing slides. A one-line guide to the controls went at the top of the screen, with Ctrl and Command both shown. The last request was a portable zip to send that day.
A pitch and a post like this one do different jobs, and the second brief was explicit about which job the deck was doing. That is why this post exists: to put the proposal on the record next to the twin's own, and to mark, slide by slide, what kind of claim each one makes.
Sixteen slides, three kinds of claim
The deck marks this distinction itself, in small print on its last slide: the moving people in Newcastle come from a real run, the districts, roads and buildings are real, and the utility networks, sensors, crowds, freight volumes and the replacement plan are "illustrative layers, laid on real roads". Here is that note turned into a map of the whole deck.
What is running: the people in Newcastle
"Every trip. Simulated." flies over Newcastle at night while coloured trails move through the streets: cars, trucks, taxis, motorbikes, bikes, walkers, buses on their routes, trains and the light rail on their lines, over two hours of a weekday morning. Nothing on it is drawn by hand. The trails are people from a completed run of the Newcastle twin - a quarter of the population, the light rail as built, 250 iterations - taken from the run's own output and thinned for the browser.
20260929T012258_250it_25pct, by mode. The deck carries a display sample per mode - 4,000 car trips, 363 bus trips, 37 on the light rail and so on - not the modes' true shares, and this figure draws a fixed fraction of that sample.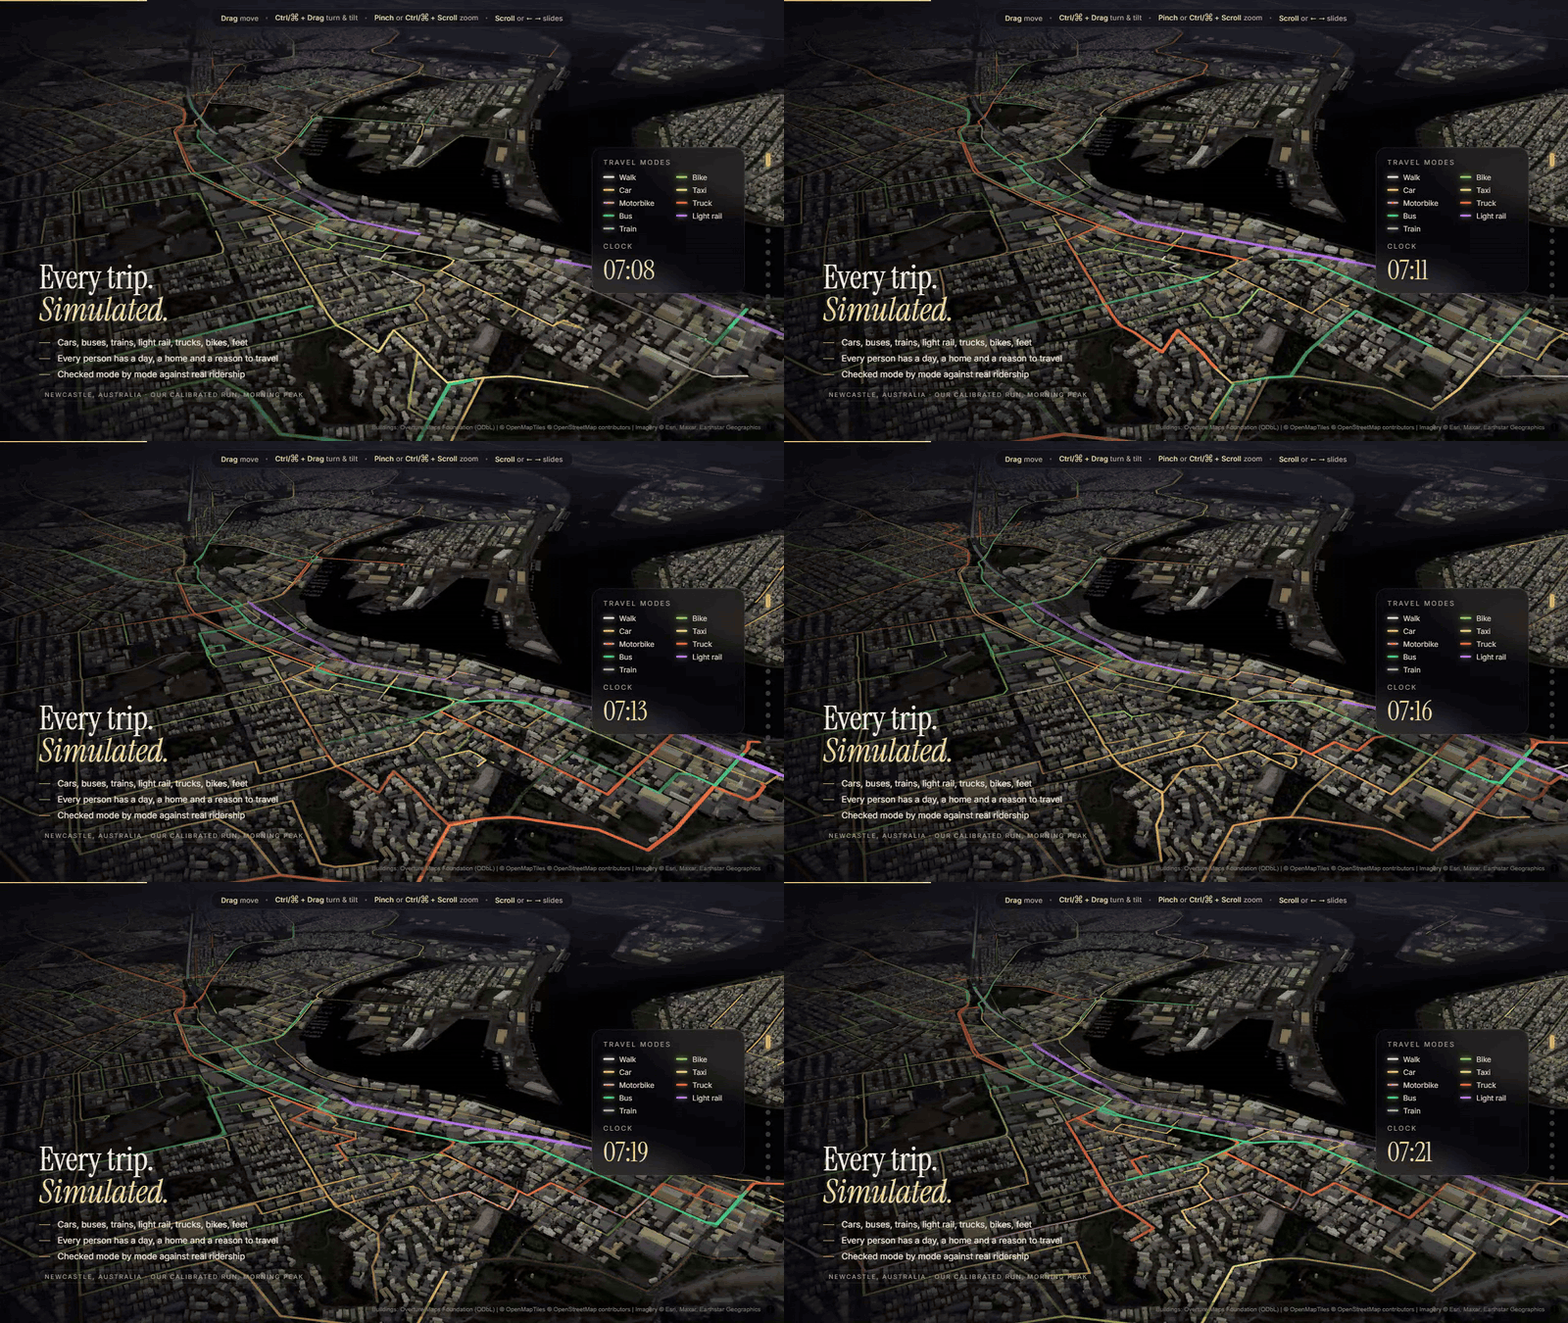
The engine-room slide puts numbers under the pictures: 27 million synthetic residents in the Mumbai-region model, one for every real person; twelve travel modes, each simulated on real roads and real timetables; every model input carrying a source, a unit and a tested range; every data file rebuildable from its raw source. Each of those is the twin as it stands. The slide's last line - "Give us the compute, and the whole city runs overnight" - describes where the Mumbai model stands: it is waiting on that machine.
Real ground, illustrative layers
The middle column is where the proposal shows what the twin would do for this city. The ground under every one of these slides is real: the roads, rail lines, district boundaries and buildings are the region's own, from OpenStreetMap and Overture's building footprints. What moves on that ground, or runs under it, is drawn in to show the capability.
Ship to shop
Seven freight corridors leave the port and the warehouse hub for Ahmedabad, Nashik, the Samruddhi expressway, Pune and Goa, each drawn on the real road network with the length the deck lists. The trucks that pulse along them, and their volumes, are illustrative; the port's 8.17 million twenty-foot container units in 2025-26 are its own published throughput. The freight slide is the one closest to the brief: a city whose reason to exist is the chain from ship to warehouse to shop.
Every system, one switch
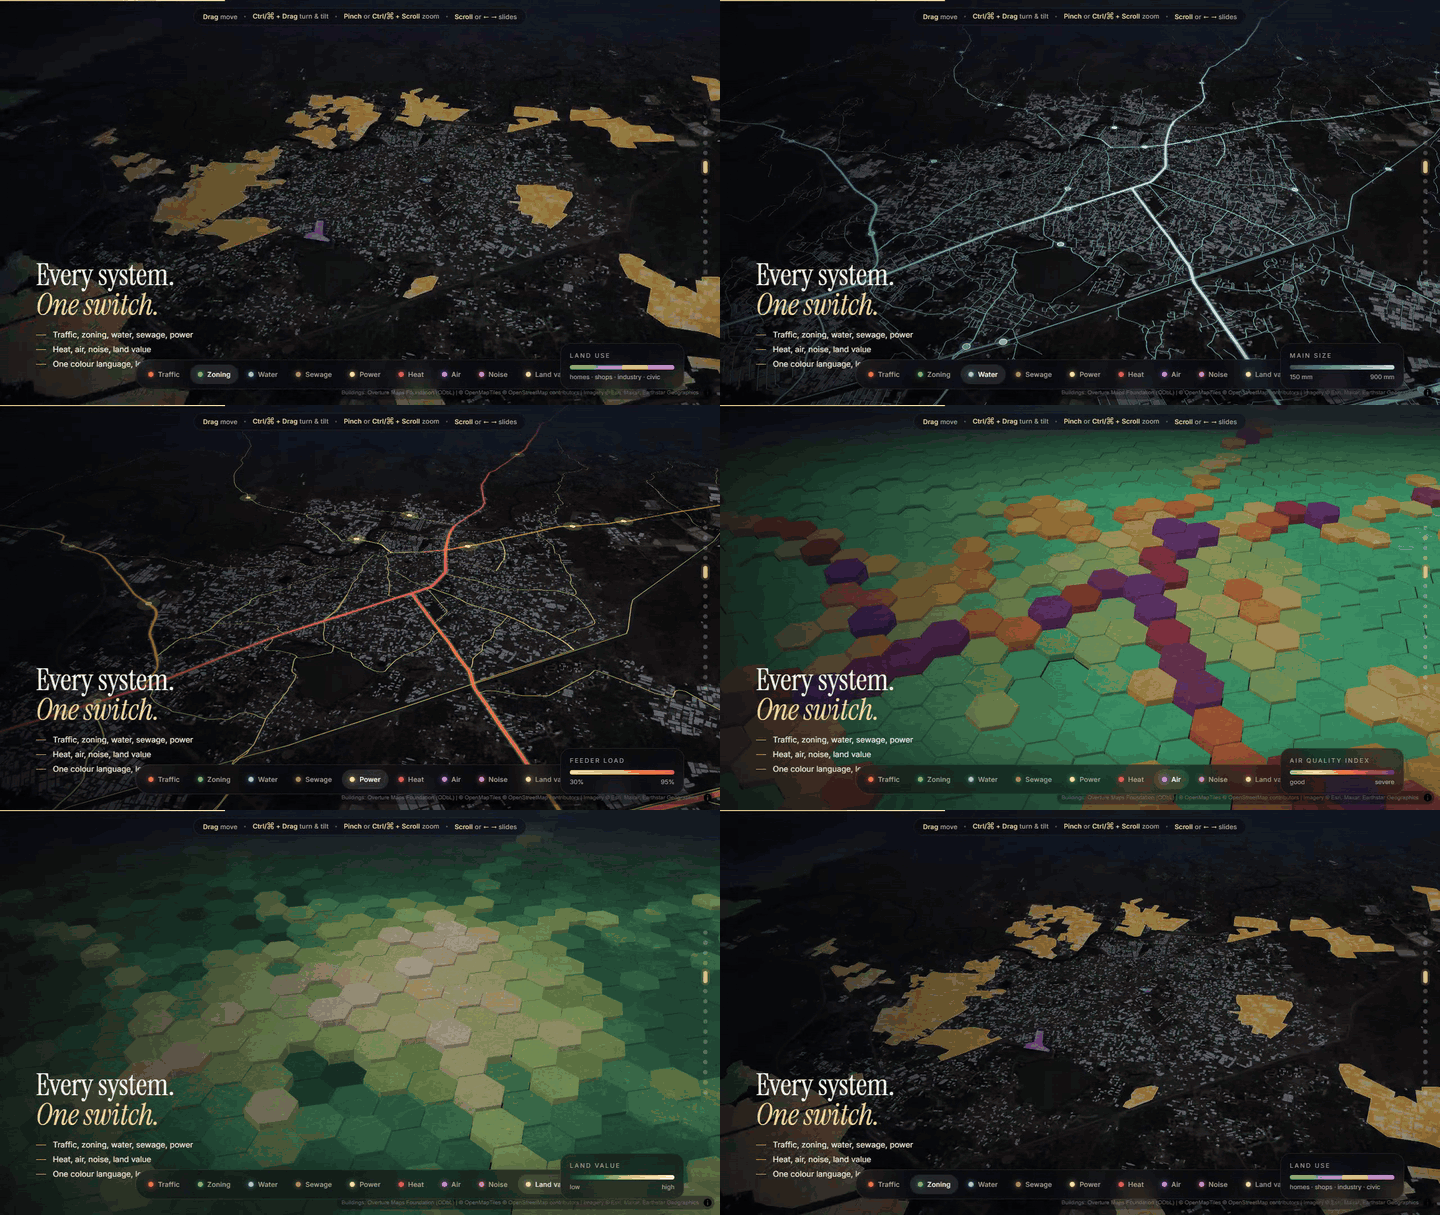
The lenses slide is the Cities: Skylines idea made literal: one city, one colour language, and a switch that flips it between traffic, zoning, water, sewage, power, heat, air quality, noise and land value. The traffic lens colours real roads by their class; the water, sewage and power networks are laid along real streets and, as the slide says, are illustrative.
Wired to the real city
The control-room slide shows the loop I previously drew as governance: sense, see, foresee, act. A pump station's outlet pressure falls, the twin plays the fault forward through the water network, forecasts how many homes lose pressure in the next forty minutes, and sends the control room the fix - start a standby pump, open a valve - instead of the alarm. The chain it names is the real one a city would use, from field controllers through SCADA and industrial messaging to the city's command centre. The incident itself is a scripted cycle.
Rehearse the monsoon, plan the big day
The flood slide raises the water on the real terrain and counts roads under water and buildings wet; the deck says plainly that this is a "bathtub fill" on the elevation model, and that a proper drainage and river model would replace it. The crowd slide applies the stadium lesson on foot. An immersion procession converges on a lake ghat. As usual, every procession leaves within half an hour for one ghat and the crowd crosses into the dangerous band. In the twin's plan, releases are staggered over three hours and the northern processions are routed to a second ghat on the river.
Scroll through time, draw it and watch it rise
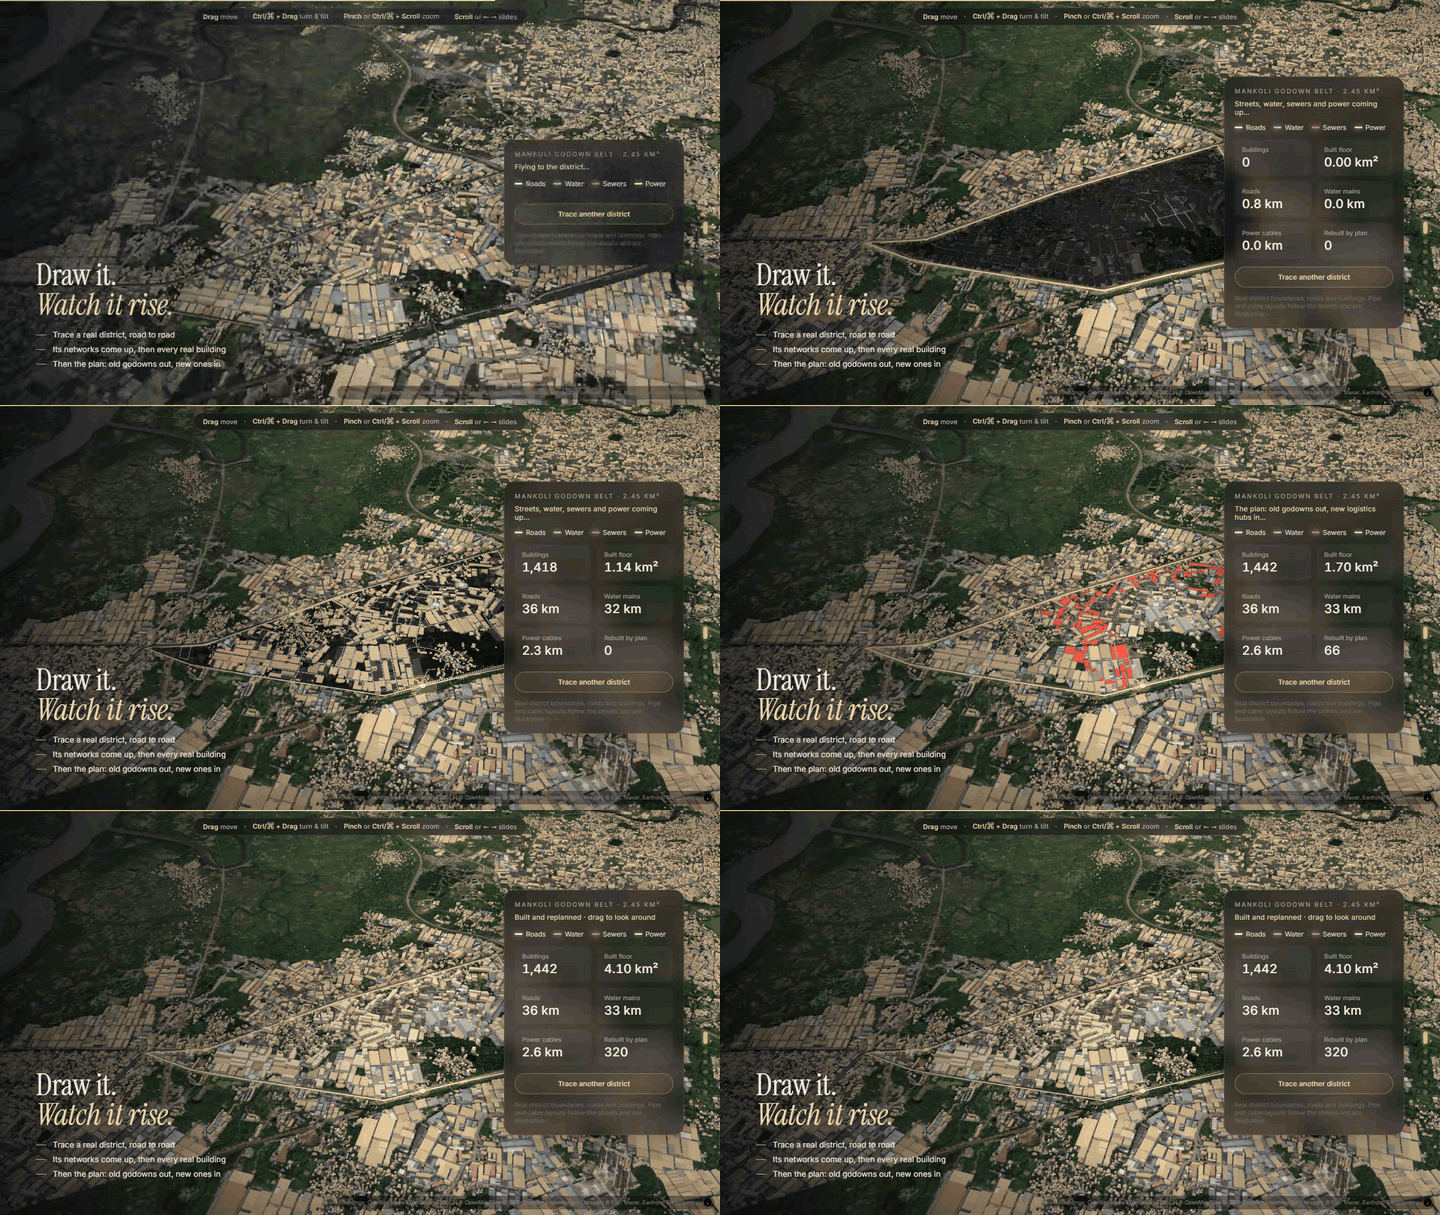
The time slide gives every road, pipe and building an age and a slider from 1970 to 2060, and lists what needs attention next. The ages are part of the demonstration, not a surveyed register of the city's assets. The planning slide traces one of seven real districts, road to road, raises its networks, then grows every real building out of the ground, then shows a plan replacing old warehouses with new ones. The boundaries and buildings are real; the pipes and cables follow the streets, and the plan is illustrative.
A direction of travel
The right-hand column says where this could go. "Predict everything" shows twelve city models on one shared ground truth - flood depth, heat islands, water demand, pipe bursts, power peaks, air quality, road wear, land value, waste routes, ambulance reach, disease hotspots, rooftop solar - and their colours over the city. "Ask the city" shows a planner typing a question in plain English, Marathi or Hindi, and the twin running the storm, the traffic and the port together before answering. Both are shown as they would look, not as things that run today.
"The best twins on Earth" is the track record turned into a shopping list. Eight twins are pinned on a globe - Shanghai, Xiong'an, Hangzhou, Singapore, Dubai, Rotterdam, Helsinki, Valencia - each with the one thing it does best and the one thing we would take from it: city-scale streaming, a twin before the concrete, live signal control, underground layers, one asset registry, port operations, open semantic 3D, leak prediction. Previously I argued that what survives is scoped. The slide keeps that lesson in its structure: each borrowed idea is one scoped capability, and the one thing the proposal adds that most of them lack is the thing this series has been building - people who move. The road map closes the column: the base twin in ninety days, people and freight moving and checked against real counts in the first year, live feeds in the second, and a twin that drafts and scores plans from the third.
How the page is built
The deck is one HTML file and eight data files, and it runs in any modern browser. MapLibre GL draws the map, with satellite imagery, terrain lifted from an elevation model, and 3D buildings streamed from Overture's footprints through PMTiles, extruded to their recorded heights where a height is recorded and estimated where it is not. deck.gl draws everything that moves: its trips layer plays each person's or truck's path against a clock, which is how a MATSim run becomes a night-time flyover. Every slide is a camera position, a mood and a set of layers; scrolling flies between them, and each slide's data loads only when it is first needed, while the next slides' buildings download in the background.
The Newcastle trails are the one piece of the deck that comes straight out of the twin: the run's output, cut to a two-hour window, sampled per mode and written as a data file the page replays. For this site the page's code and fonts are served from here rather than from content delivery networks; only the map tiles stream from their providers, which is why the proposal needs a connection.
Where the pitch and the record differ
In three places the proposal and the twin's record say different things.
- "Our calibrated run." The Newcastle slide's caption calls it that. In the twin's own terms it is a completed run, not a calibrated one: it put 1 of 12 modes inside 10% of real ridership, and the next run, the scoreboard shown previously, put 2. No parameter has yet been fitted to the targets.
- The engine room's inputs. The slide counts 594 declared inputs, the registry's size the day the deck was built; it is 600 now. The 968 versioned files match.
- The Mumbai model. Its 27 million synthetic residents exist, on a network and timetables built from Indian sources. It has no ridership reading yet: the smallest honest run needs a machine several times larger than the one it was built on.
The proposal is here unchanged, as it was sent. The twin's record is public too, with every run, target and decision behind the numbers above.
The full proposal
Open The City, Twice - sixteen slides, best on a large screen in Chrome or Edge. Scroll or use the arrow keys to move between slides; drag to move the map, Ctrl or Command and drag to turn and tilt, pinch or Ctrl and scroll to zoom; hover any dotted term for a plain-English definition. The first visit takes a few seconds while the 3D buildings arrive.
Sources & anchors
- The proposal, hosted in full - /digital-twins/the-city-twice/ · its libraries: MapLibre GL JS - maplibre.org · deck.gl - deck.gl · PMTiles - github.com/protomaps/PMTiles · Overture Maps buildings - overturemaps.org
- The Newcastle run the trails come from, and its reading - DECISIONS.md, section 9.217 · the current scoreboard - docs/STATUS.md · the Mumbai model - cities/mumbai/docs/README.md
- Twins the proposal borrows from - Shanghai (51World) - unrealengine.com · Xiong'an - en.people.cn · Hangzhou City Brain - en.wikipedia.org · Virtual Singapore - en.wikipedia.org · Rotterdam port - newsroom.ibm.com · Helsinki - aec-business.com · Valencia water - idrica.com · urban twins in China - geoawesome.com
- Crowds, floods and city-builder views - Fruin's levels of service (G. K. Still) - gkstill.com · Hajj crowd simulation, JASSS - jasss.org · iFLOWS-Mumbai flood warning - pib.gov.in · Cities: Skylines II info views - cs2.paradoxwikis.com